Using Tableau & Python to Explore the Impact of Ridesharing on Road Safety in Austin
- Robbie Geoghegan

- Jan 2, 2020
- 6 min read
Ridesharing companies such as Uber and Lyft have experienced explosive growth over the past decade, Uber alone estimates 14 million trips are completed each day around the world. This ridesharing phenomenon has revolutionised how commuters travel on our roadways.
Both Uber and Lyft advertise the benefits that ridesharing delivers to society, including through improved road safety and decreased drunk driving. The Uber website reports that “services like Uber—where passengers push a button and get a ride in minutes—are helping to curb drunk driving.” However, third party research does not find a clear correlation between increased ridesharing and increased road safety. For example, this article in MIT Technology Review actually suggests ridesharing led to a higher number of deaths on the road due to the congestion caused by drivers who spend 40-60% of their time searching for riders. Research also points out that the impact of ridesharing is unevenly felt in different geographical regions, for example an estimated 13% of total vehicle miles traveled in San Francisco were by Uber and Lyft drivers compared with 2% in Seattle and far less in regional areas.
We sought to test the impact of ridesharing on road safety and drunk driving using Austin as a test case. Austin is an interesting test case for several reasons. Firstly, Austin is unique in that Uber and Lyft entered the market in June 2014 then left due to government regulation in May 2016 then re-entered the following year in May 2017 (note other local ridesharing companies such as Ride Austin were active during the period where Uber and Lyft exited and reentered). These time segments provide interesting points of comparison to analyze the impact of ridesharing on traffic incidents across the city. Specifically our objectives were to test for Austin whether ridesharing impacted:
The number of car incidents due to drunk driving
Demographics of people involved in accidents
Accident locations
DATA SELECTION
Data was sourced directly from the Texas Department of Transportation (TXDoT) and included 10 years of crash data for Austin. The data is very detailed; each year has around 20MB of information across 10 data tables. Information includes crash information such as crash location, driver information, police charges and crash severity. Raw and cleaned data can be found on my Github.
Throughout the analysis we have broken the crash data into 4 time periods:
Before ridesharing (January 2010 - June 2014)
Ridesharing enters (June 2014 - May 2016)
Uber and Lyft exit (May 2016 - May 2017)
Uber and Lyft re-enter (May 2017 - July 2019)
The analysis also considers the major growth that Austin has experienced over this 10 year time period which we have assumed would increase the volume of crashes linearly. We have therefore normalized for population for each month.
DRUNK DRIVING TRAFFIC INCIDENTS
We first wanted to test the overall trend in drink driving reported incidents. We used the data table which recorded if police charges were prosecuted and what type of charge the driver received. More than 90% of data in this field is empty due to the majority of crashes not having a police presence or not resulting in criminal charges. We inferred that an empty cell therefore meant no evidence of drink driving, however this probably underestimates the actual volume. The below graph shows the % of crashes due to drink driving on top and the number of crashes due to drink driving on the bottom.
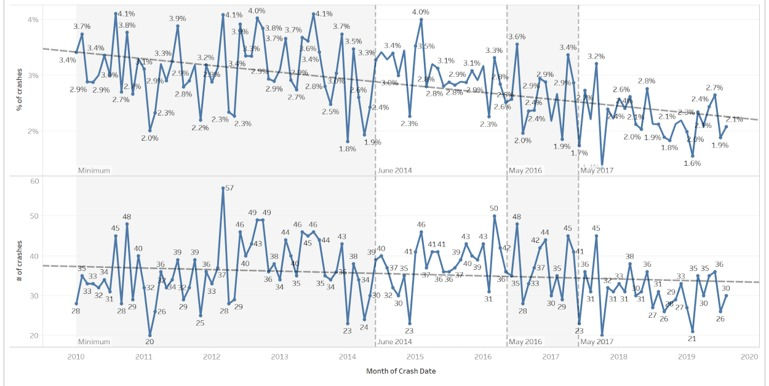
We see a clear downward trend in the percentage of crashes due to drink driving over time while the volume stays relatively stable (due to the increase in crashes overall, assumed to be due to population growth). We tested the statistical significance of these time periods in predicting the percentage of drink driving incidents and all time periods have statistically significant coefficients. This correlation supports Uber and Lyfts assertion that ridesharing helps curb drink driving.
There is a less clear trend when analyzing the total volume of crashes.
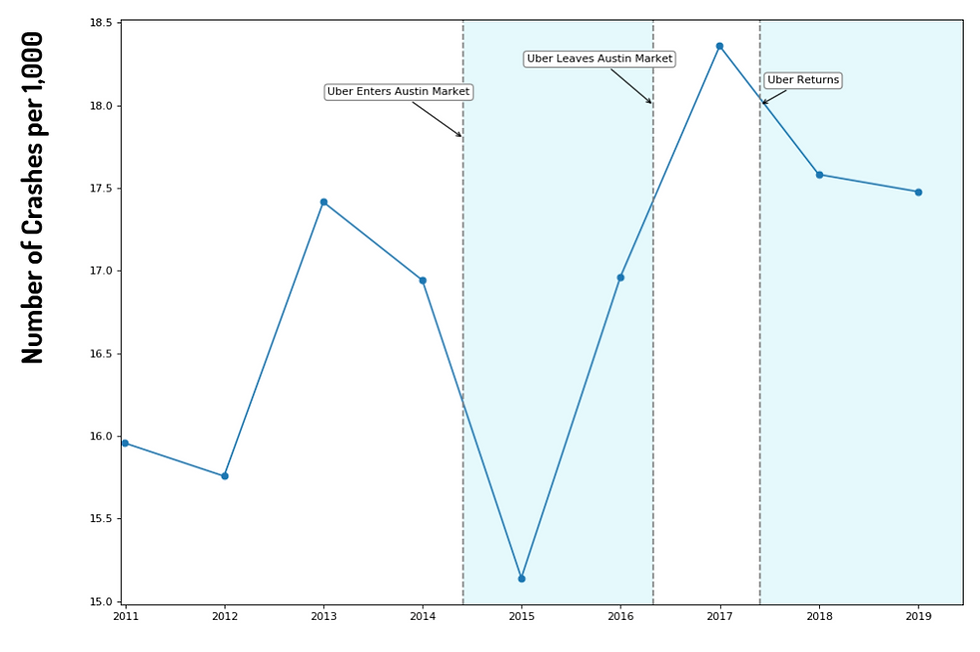
We see a very steep decline in crashes in 2015 when ridesharing first enters the Austin market before a steep increase above pre-ridesharing levels. The 2015 drop seemed suspiciously large so tested against confounding variables such as gas prices and construction. High gas prices have been found to reduce car use and crashes; in 2015 gas prices actually reduced substantially and stayed at this level to 2019, which should have the opposite effect we see above. Construction has also been found to increase crashes, however Austin say a steady increase in construction year on year from 2010.
We also tested the impact on crashes at different times of day and the change in crash severity.
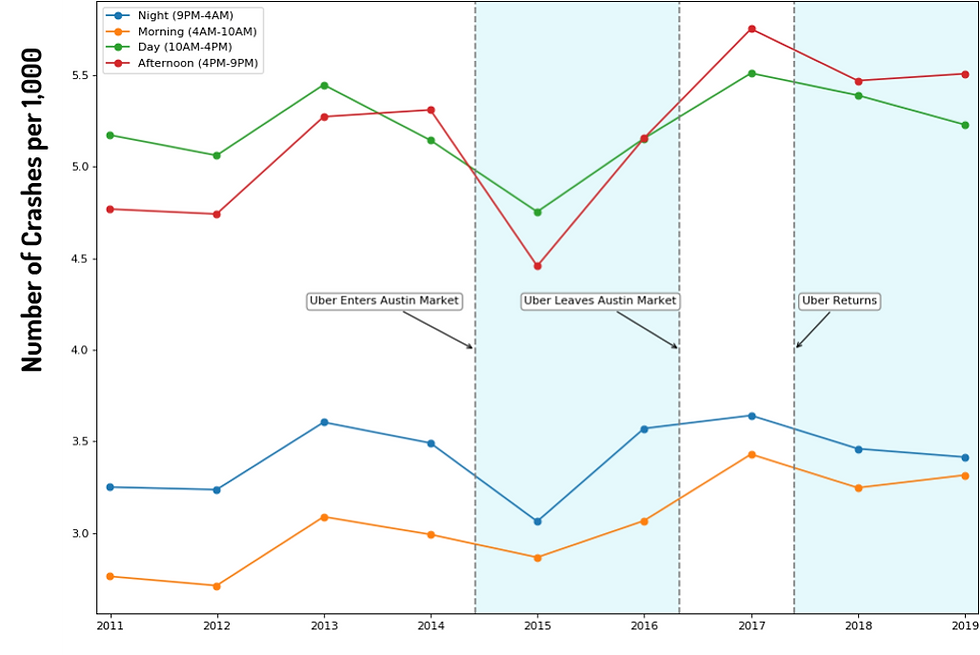
Volume of crashes at different time periods all initially decline in 2015 but show no long term evidence of reduction from 2016 onward. The most severe crashes (in red) appear to have risen since ridesharing.

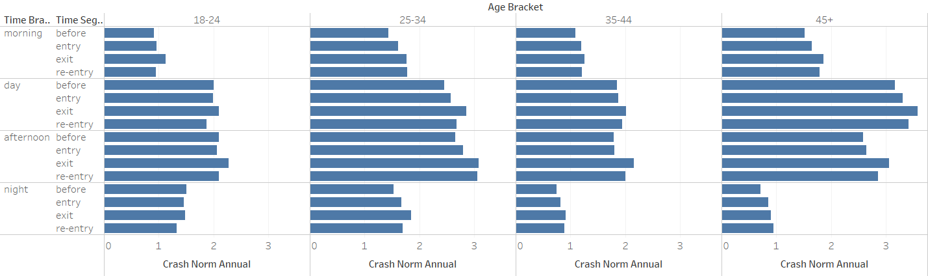
DEMOGRAPHICS OF PEOPLE INVOLVED IN ACCIDENTS
A hypothesis we had before conducting our analysis was that younger people may be more frequent ridesharing users and would have the most significant decrease in crashes. However we did not find any data to support this.
Similarly we did not see significant shifts in the gender of drivers involved in crashes.

ACCIDENT LOCATIONS
As a final piece of analysis we wanted to test whether the location of traffic incidents changed during these time periods.
To explore the location data, we mapped the latitudes and longitudes for every incident over the 10 year period. On the below Tableau map you can zoom in and out of different locations to see where incidents are concentrated.
While useful for exploration, it is difficult to draw insights from this view of data.
To provide a more useful view of data we aggregated crash volumes to local areas and took the difference between pre-ridesharing volumes to post-ridesharing periods (annualized and normalized). The below interactive map allows you to zoom in and out of areas across Austin, select the time period in the top right and hover over locations to see the change in volume (measured as crashes per 1,000 people).
This map shows the most clear impact of ridesharing which has driven down crashes in the CBD, around the University of Texas and at major shopping areas. Conversely areas in the outer regions of the city, South Congress and the airport have seen substantial increases in crashes.
The largest percentage decrease occurred around the University of Texas and the largest percentage increase occurred around the airport. The CBD had the largest volume decrease in crashes across the city.
CONCLUSION
Overall there appears to be some correlation between ridesharing and changes in traffic incidents, however these only represent correlation not causation and there are many confounding variables that have also impacted traffic incidents during these 10 years.
What the data says
We see a downward trend in the percentage of drunk driving incidents, however during these 10 years there has also been decrease in the cultural acceptance of drink driving which may be the causal reason for the trend
When ridesharing entered the Austin market there was a steep decline in traffic incidents but this bounced back to pre-ridesharing levels in ensuing years; we hypothesize this may be in part due to discounted fares and low prices offered to riders initially which are not accessible any more
There is no material changes in the demographics of drivers involved in crashes
Changes in traffic incidents are varied across the city; we hypothesize this to be in part due to ridesharing and also due to specific points of construction and concentrations of population growth
The University of Texas has seen the largest decline in crashes; we expect this is partly due to younger people using ridesharing more frequently but also due to improved public transport to the campus and reduced parking on campus
The airport has seen the largest increase in crashes; we expect this is partly due to more travelers using ridesharing and the airport not having proper ridesharing infrastructure but also due to the major increase in traffic volume over these 10 years
We conclude that it is very difficult for Uber and Lyft to assert that ridesharing makes the roads safer due to the above analysis and amount of confounding variables.
GITHUB REPOSITORY
RESOURCES
This analysis was conducted with my colleagues Rachel Meade, Sebastian Osorio Agudelo, Catherine Yu Miao, and Danyang Zhang


Comments